
April 26, 2017
Web Services with Rust Part 2: Baseline Revisited
In the last posting I started exploring implementing Web services in Rust, using hyper with some minimal single- and multi-threaded servers.
If you have been paying attention to the test setup description there (as I should have done) you will have noticed that the load test configuration is limiting the number of clients to 500. Many requests with few clients are not the common case reality for most Web services and definitely not what I had in mind when I ran the tests.
Then again, few clients that send many requests is probably exactly what we want to test for a micro services environment when thinking about not public facing services.
Given that Tokio and hyper allow for controlling what happens at the per-connection- and thread level let’s take another turn at exploring different usage patterns and establishing a baseline. We can leverage the configuration options of StormForger to extend the test scenarios.
A note on StormForger: I have worked with them in a previous client project where they provided their platform and traffic modeling and result analysis support. We very much benefited from their deep understanding of load testing issues and their traffic shaping DSL makes creating test scenarios a breeze. Naturally, I picked them for this exploration and since they graciously fuel my tests here, I am more than happy to give credit :-)
Instrumenting the Server
While StormForger is providing excellent reports on the test runs, I still want to measure directly in the server to get a better picture of what is happening and to verify the assumptions I make about the Rust and Tokio ecosystems.
Recently Prometheus has become my application metrics system of choice and since a Prometheus client for Rust already exists (apparently developed and used by the TiKV Team) I have used this to implement an instrumented minimal hyper server.
One gauge metric keeps track of the number of connected clients and a histogram is used to measure the individual requests.
So, let’s see what the instruments report when we throw load at the server.
Test Case: Many-Clients-One-Request
This test case focuses on maximizing the number of clients while having each client just send a single request. My goal is to use this to get as many clients as possible connected in parallel while minimizing the time they spend being served.
The StormForger test case setup:
definition.setTarget("xxx:8080");

definition.setArrivalPhases([
  { duration: 20, rate: 20},
  { duration: 20, rate: 60},
  { duration: 20, rate: 100},
  { duration: 20, rate: 120},
  { duration: 20, rate: 160},
  { duration: 20, rate: 180},
  { duration: 20, rate: 200},
  { duration: 20, rate: 210},
  { duration: 20, rate: 220},
  { duration: 20, rate: 230},
  { duration: 20, rate: 240},
  { duration: 20, rate: 250},
  { duration: 20, rate: 260},
  { duration: 20, rate: 270},
  { duration: 20, rate: 280},
  { duration: 20, rate: 290},
  { duration: 20, rate: 300},
  { duration: 20, rate: 310},
  { duration: 20, rate: 320},
  { duration: 20, rate: 330},
  { duration: 20, rate: 340},
  { duration: 20, rate: 350},
]);

definition.setTestOptions({
  cluster: { sizing: "large", },
});

definition.session("ManyClientsOneRequest", function(context) {
  context.get("/data", { tag: "root" });
});
This test runs for about 7 minutes and gradually increases the rate of arriving clients from 20/s to 350/s, each doing a single request.
When running this against a single threaded version of our test server, the response latencies start to degrade at about 200 req/s. This is the maximum throughput of the server, requests start to pile up and are completed down the line with very high latencies.
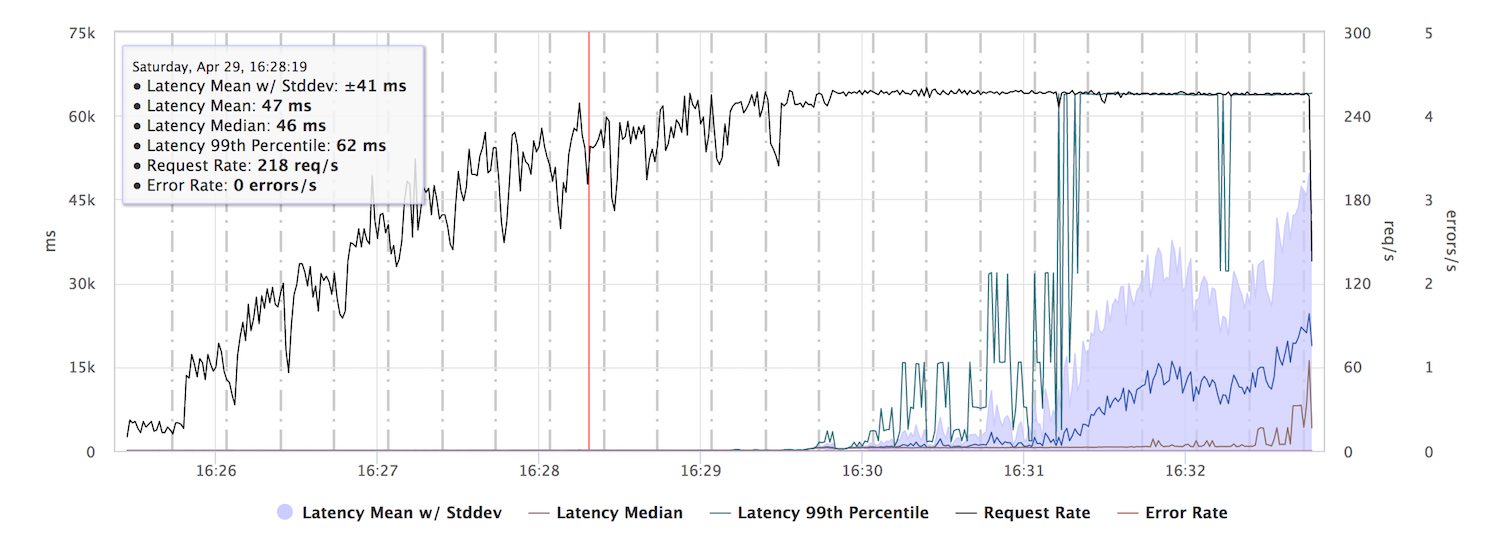
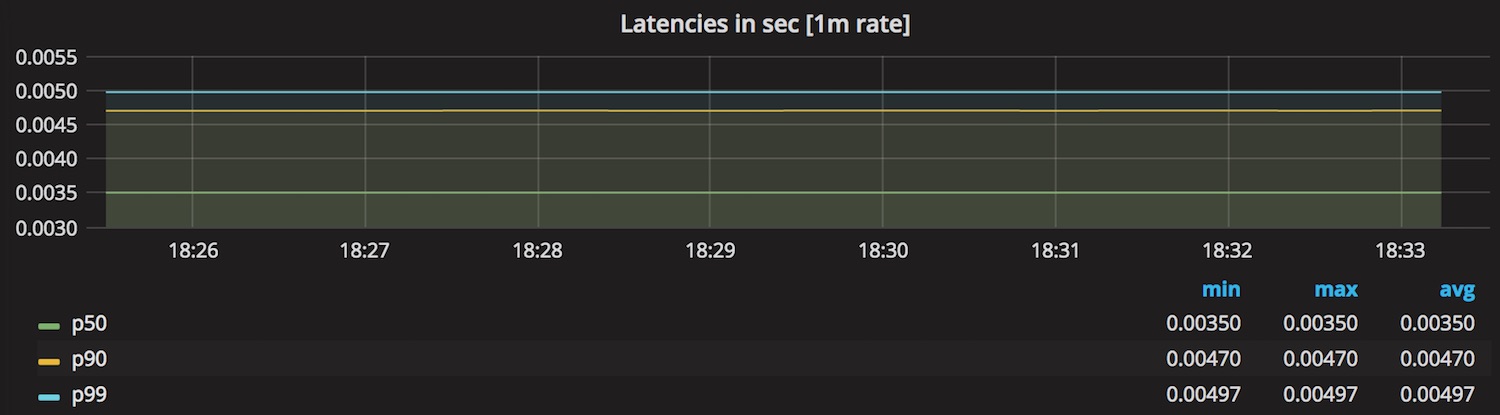
While a capacity of 200 req/s seems surprisingly low for our server, a look at the internal latency metrics for the CPU intensive work the server is doing provides an explanation. Each work operation takes around 4ms and this plus network stack operations is roughly what fits 200 times into a second.
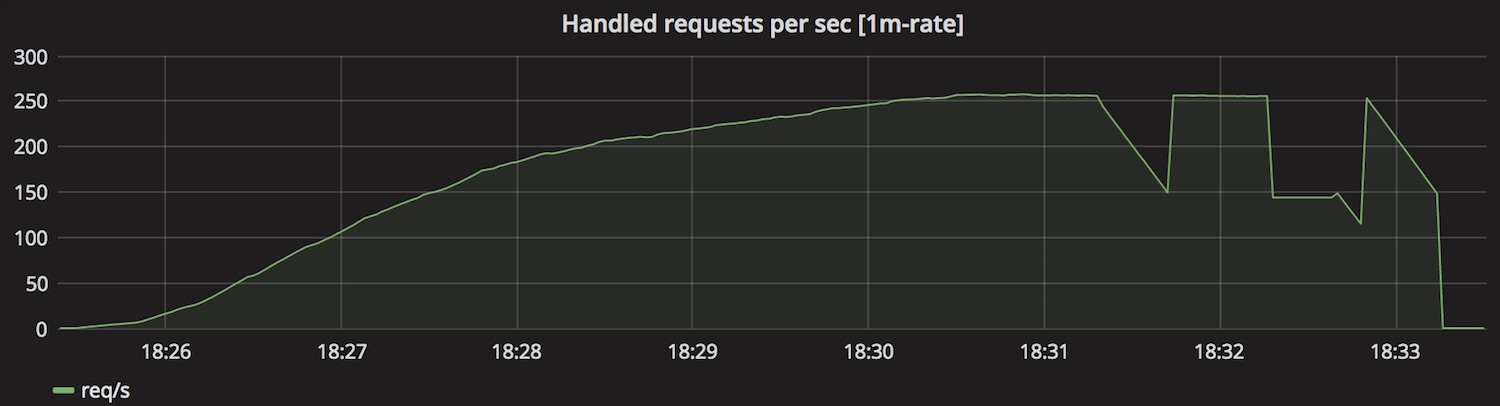
The next graph shows the rate of internally completed requests, which roughly corresponds to the request rate measured on the client side.
Out of curiosity I also took the count and rate of connections the server has taken from the listen queue.
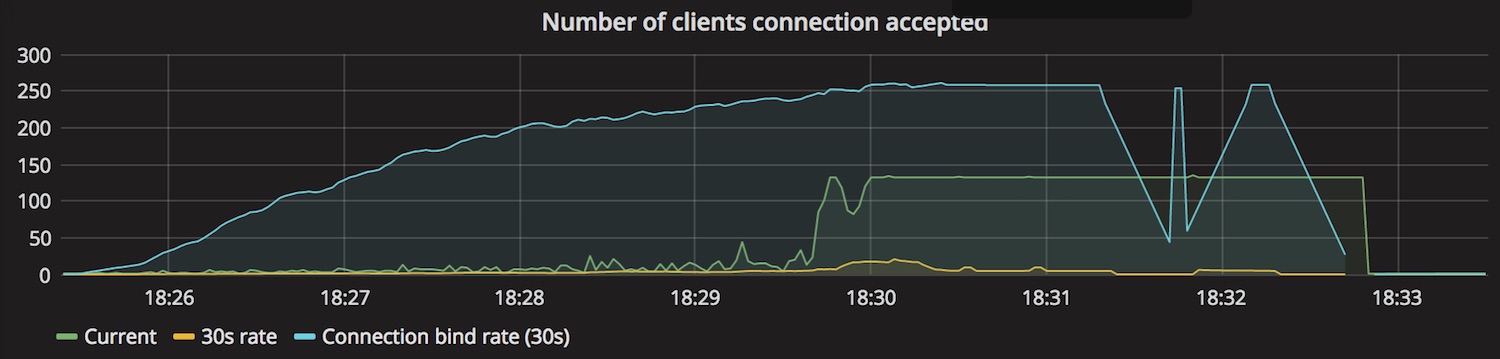
The server is using a listen queue size of 128 and that corresponds very much to the number of current requests in the graph. This leaves me a bit puzzled, because I would have thought that, given the asynchronous nature of Tokio, the server would just grab all the requests it can get of the queue, leading to an increasing number of connected clients. Changing the queue size affects the number of current connections so there is clearly something going on I do not yet understand to be investigated at later time. (Some interesting details of the listen queue are discussed in How TCP backlog works in Linux)
Having said that, changing the listen queue capacity did not affect performance results so I leave it at that for now.
Take Away
I did some cross checking with more threads and reduced CPU intensive work, confirming that the conclusions above at least make sense and that I can now proceed with a better baseline than I had established in part 1 of this series.
Although obvious, I found it an interesting observation that the capacity of an asynchronous server eventually is a function of the latency of the CPU bound work it is doing. Hence, if we want to leverage the no-cost abstractions nature of Rust and asynchronous IO to squeeze more capacity out of the available resources, activities like HTML template rendering or JSON serialization/deserialization directly impact the capacity limit of a server.